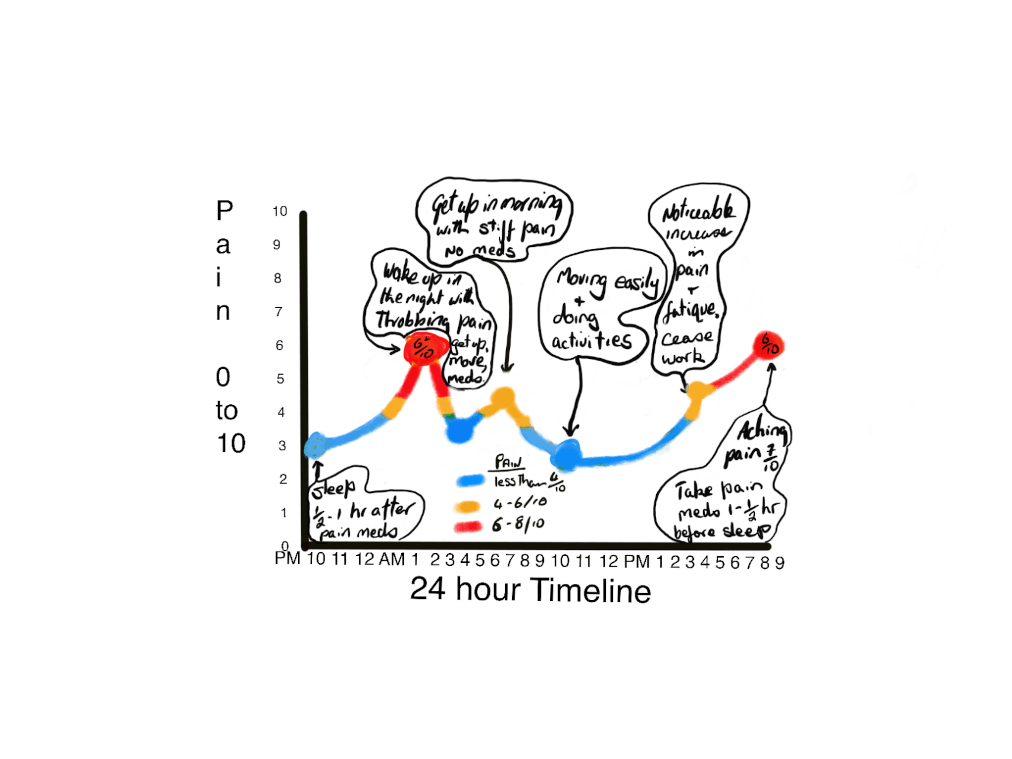
DRAW a 24 hour Pain Pattern
Using the graph as an example, draw the changes in your pain over a 24 hour cycle, including the severity of pain (score 0 to 10), when you take pain relief medication, and when the pain increased and decreased.
OOPS
PAIN GRAPHS
If you already have pain for a week or more, to help a physiotherapist diagnose your condition and to assess your improvement accurately, draw your pain on a graph according to how it fluctuates. See the instructions for drawing pain graphs on devices.
As from the examples below:
(i) Draw the pain pattern over 24 hours (1 day), and;
(ii) Draw how activities over 24 hours effects the pain.
Note on the graphs, when the pain is the worst eg pain wakes you from sleep; when it is least; and any activity or time that worsens the pain.
Download the blank graph image below.
Redraw the graphs every week or two to measure the change that is occurring with healing and rehabilitation.
Using the graph as an example, draw the changes in your pain over a 24 hour cycle, including the severity of pain (score 0 to 10), when you take pain relief medication, and when the pain increased and decreased.
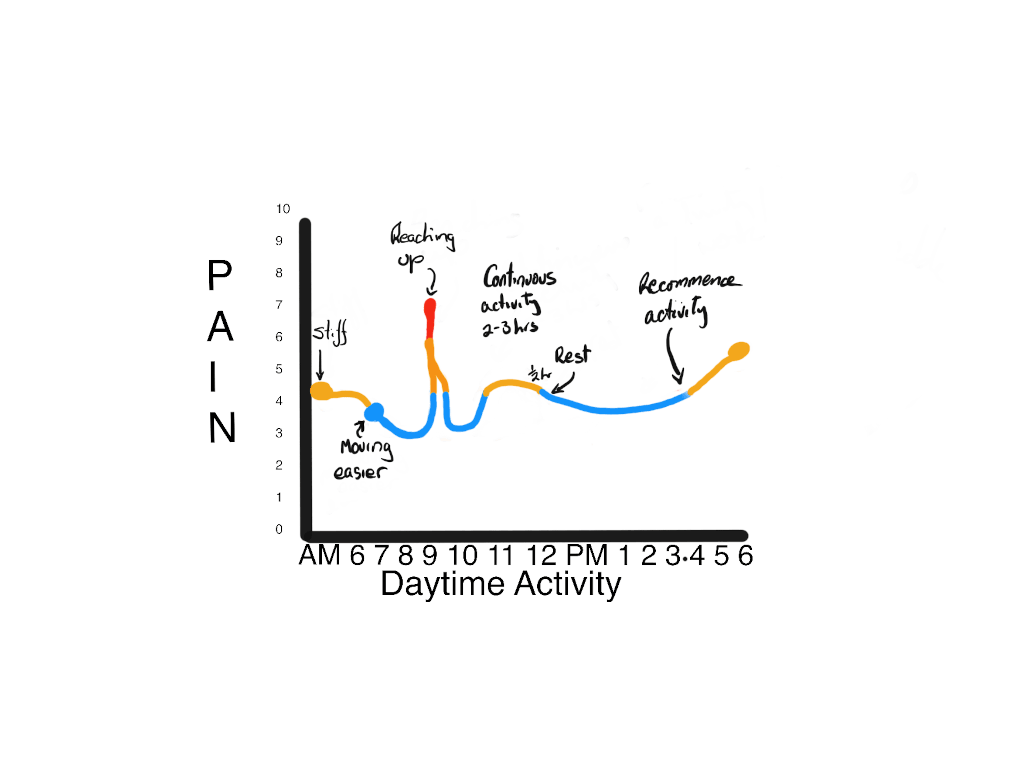
Using the graph as an example, draw the time you spend in activities and the change in pain.